UX/UI DesignUnited Kingdom
Codepixel’s work has been truly good.
5.0
An enterprise platform that brings revenue optimisation, demand forecasting, network planning and customer insight into one place, so airline commercial teams decide on predictive intelligence instead of lagging reports.
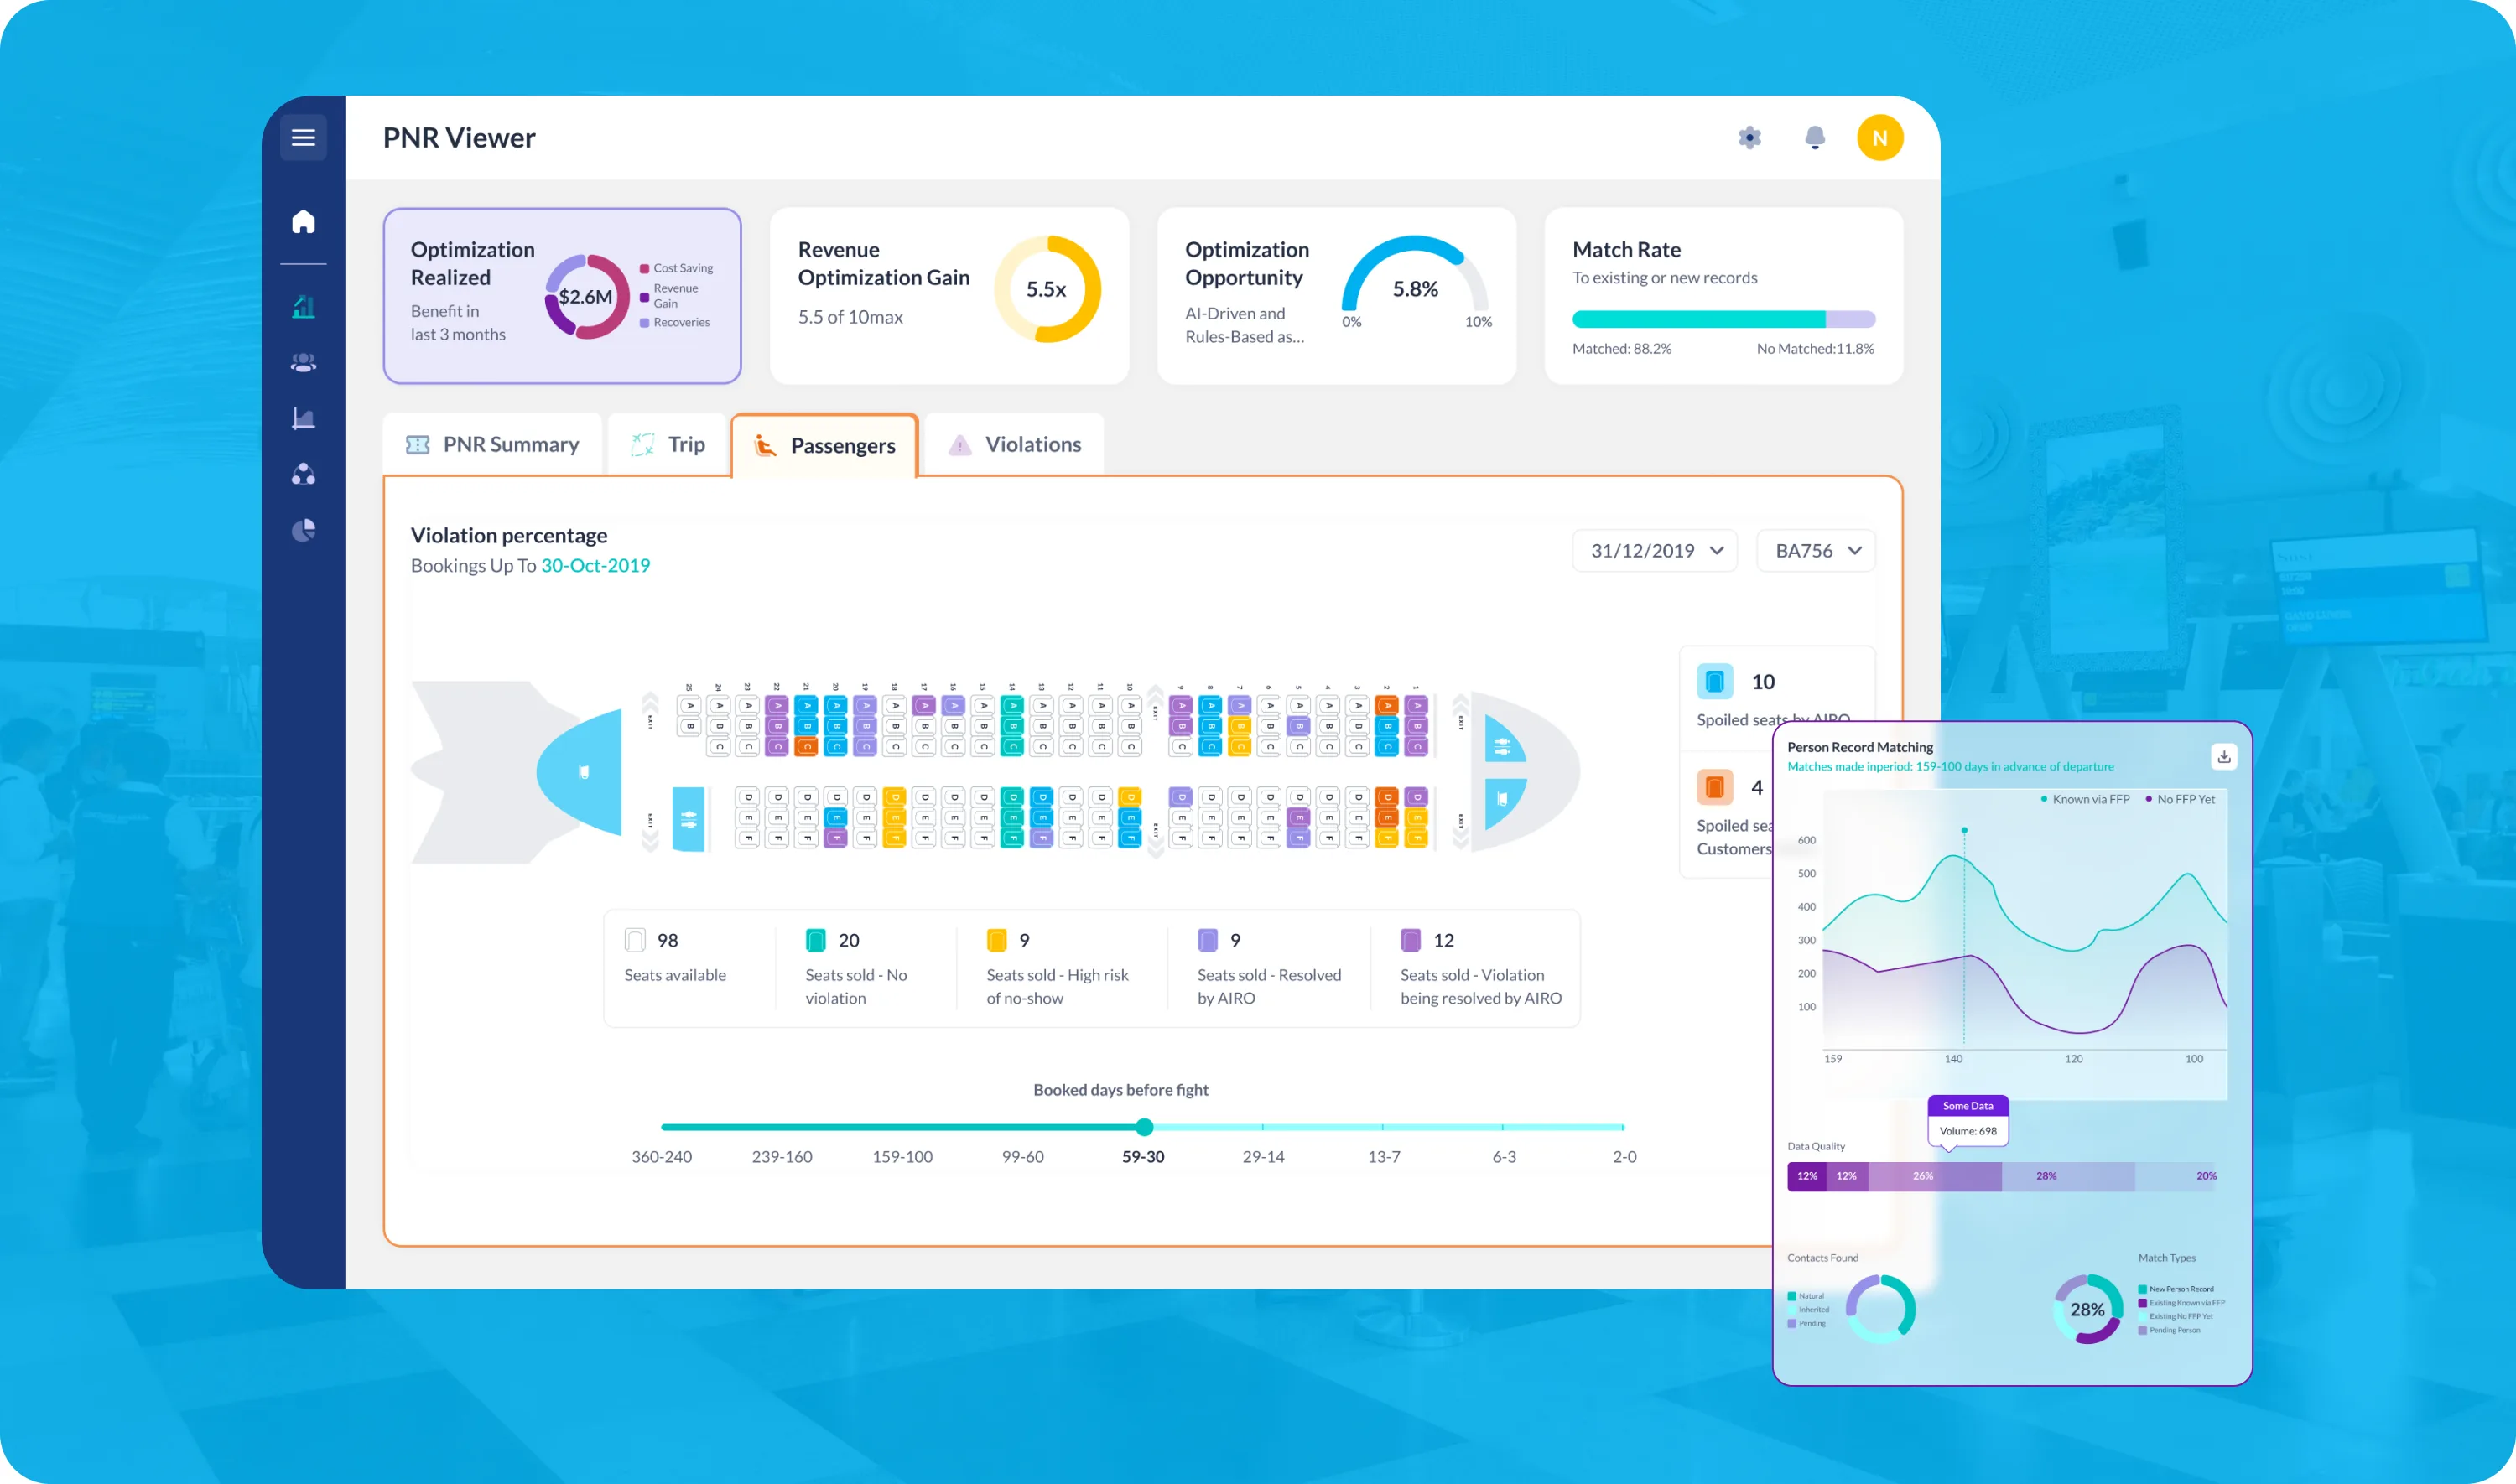
Airevo is an AI-powered enterprise platform for airline commercial departments. It combines data intelligence, predictive analytics and automation to help airlines improve revenue, distribution, route planning and customer operations at scale.
We took it from discovery to a working product: workshop sessions to understand how a commercial team actually decides, a design system built to the client's brand, and the screens and data models that turn dense operational data into something a team can act on.
Airline commercial teams work in a market that never sits still: pricing, routes, customer behaviour and distribution channels all move at once. The systems they had were rigid, blind to what came next and split across tools, so visibility was partial and strategic decisions were slow. They needed one place that could hold the whole commercial picture and predict where it was heading.
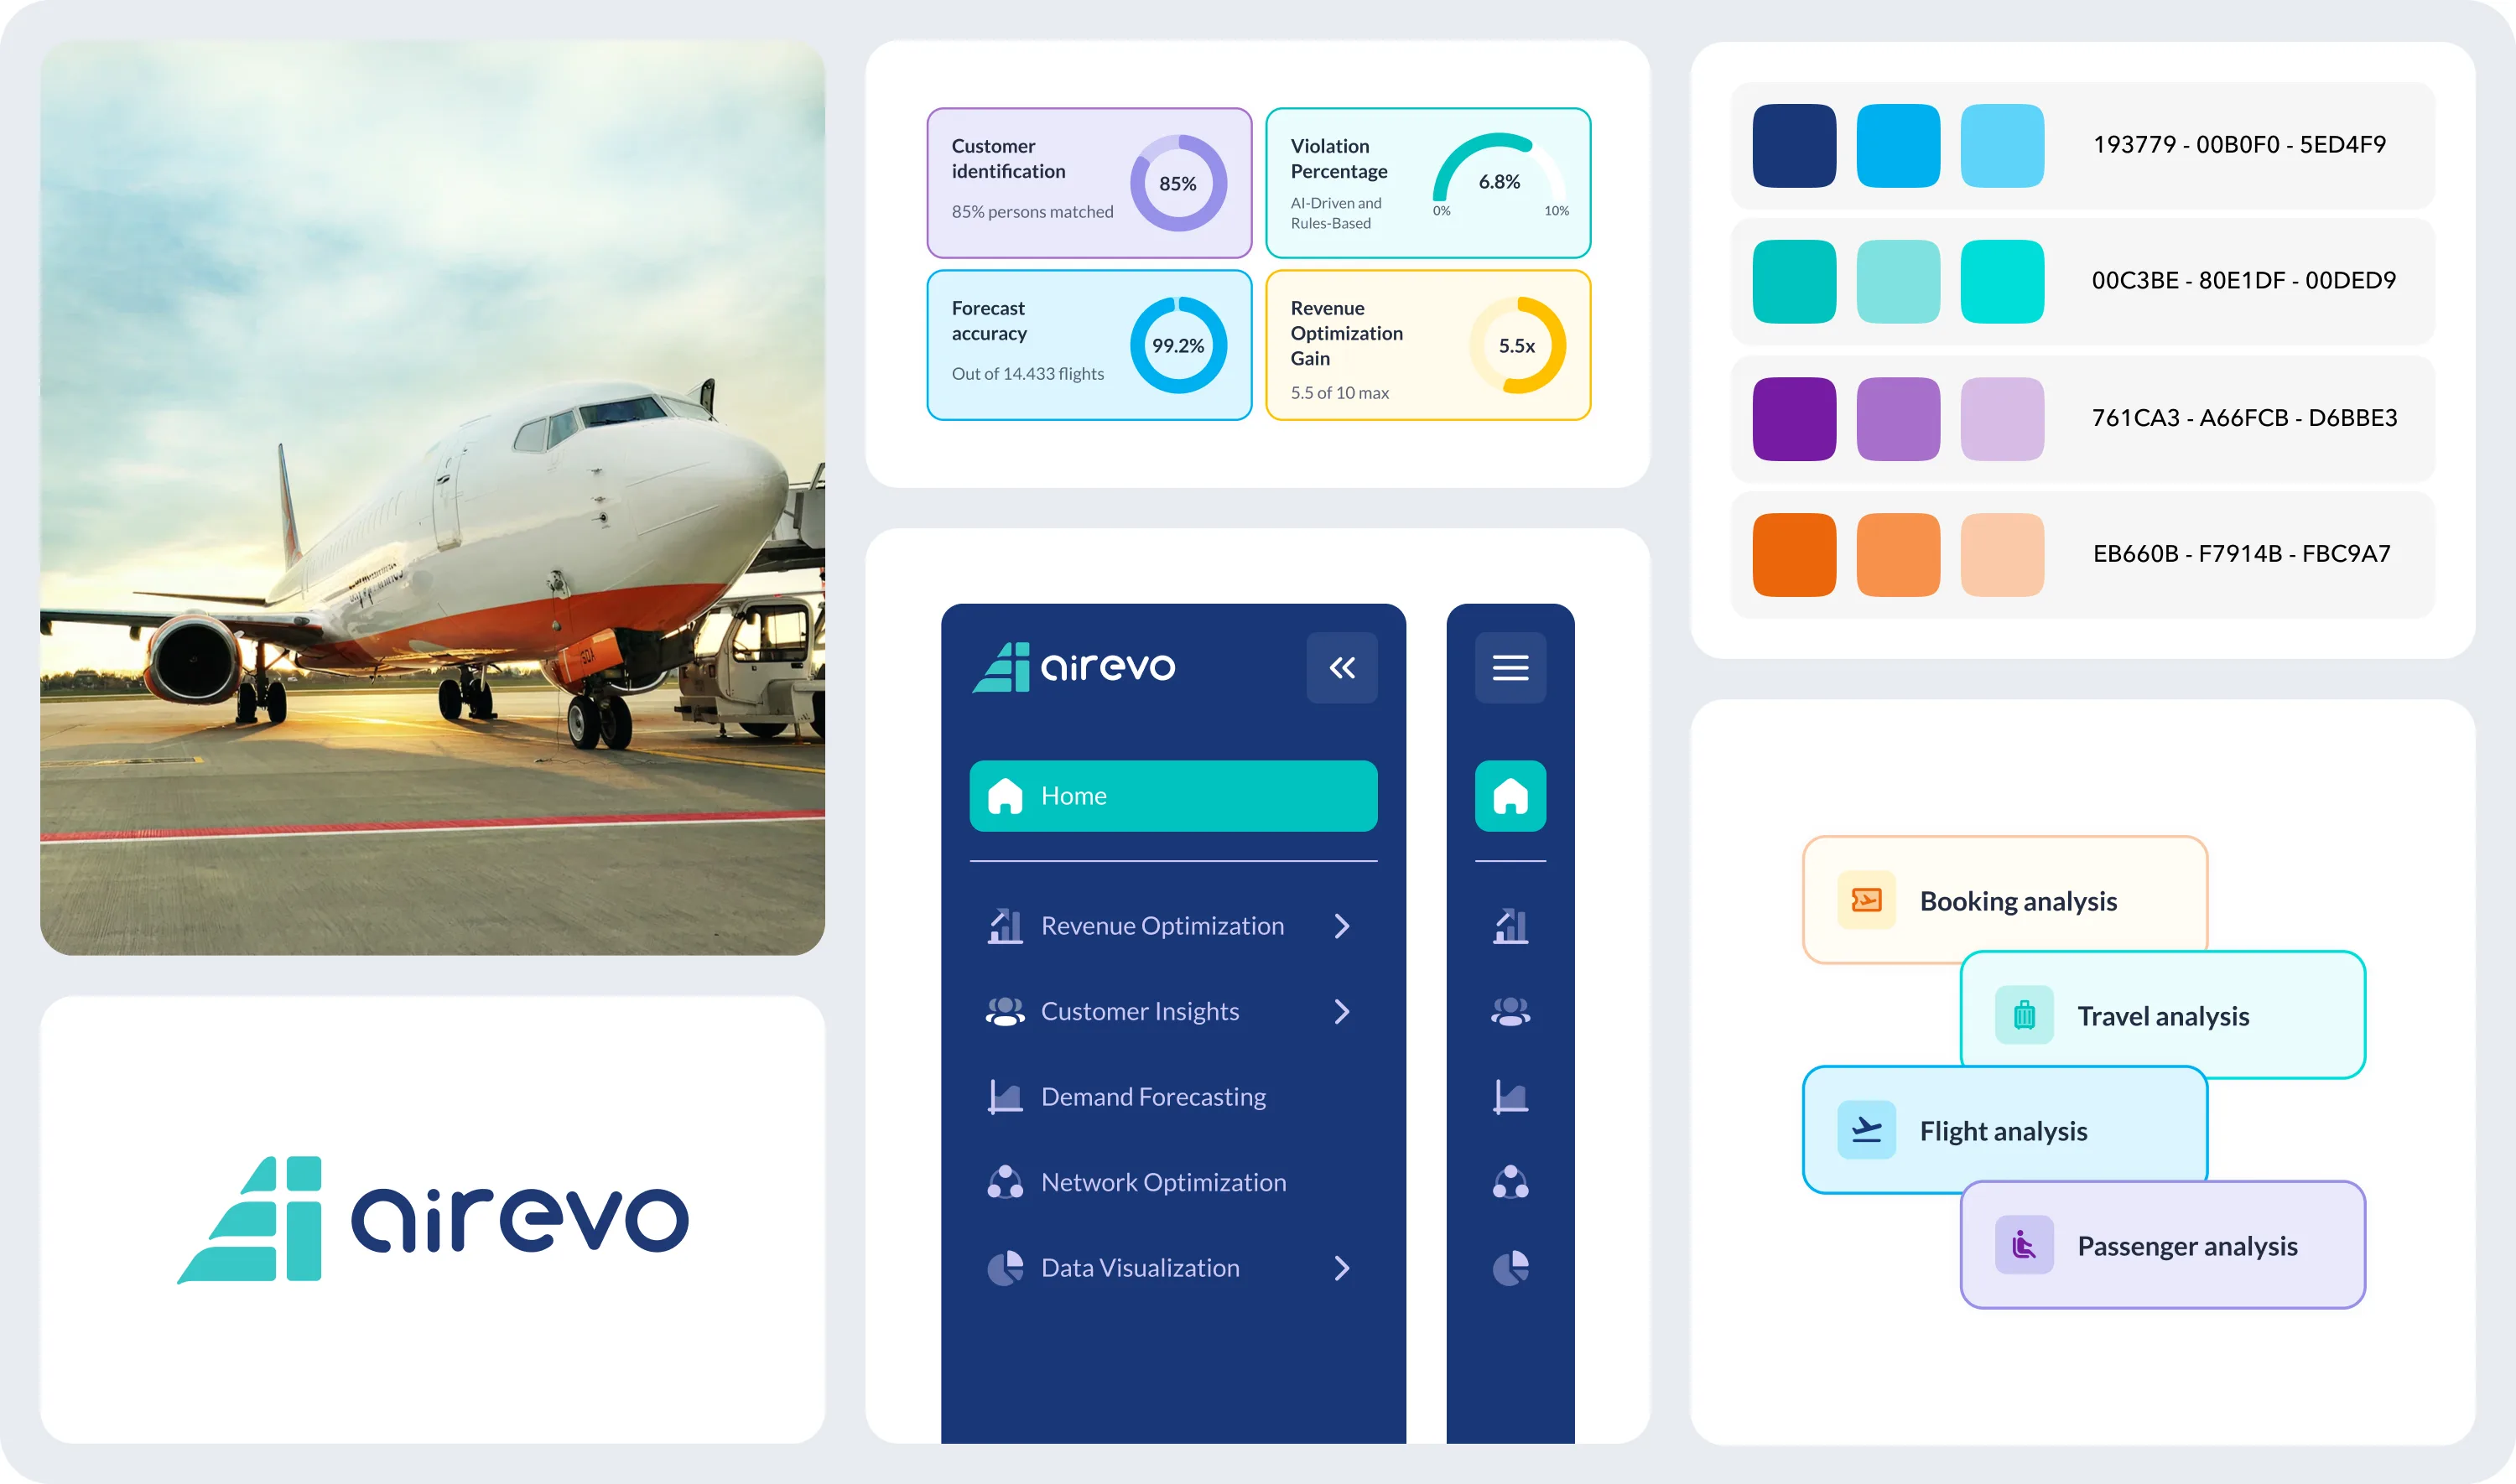
From workshops to a design system in the airline's own brand.
The engagement started in the room, not the codebase. Discovery and workshop sessions mapped how a commercial team actually makes decisions, and what a platform would have to show them to be trusted.
From there we built a component library to the client's brand guidelines and designed the screens that present dense operational data clearly. The interface does the hard work: making complex numbers legible at a glance, so the intelligence underneath is actually usable.
Plan routes around what the data says, not last year's schedule.
Network optimisation brings route and network planning into the same intelligence layer, so schedule and capacity decisions are made against real demand signals rather than habit.
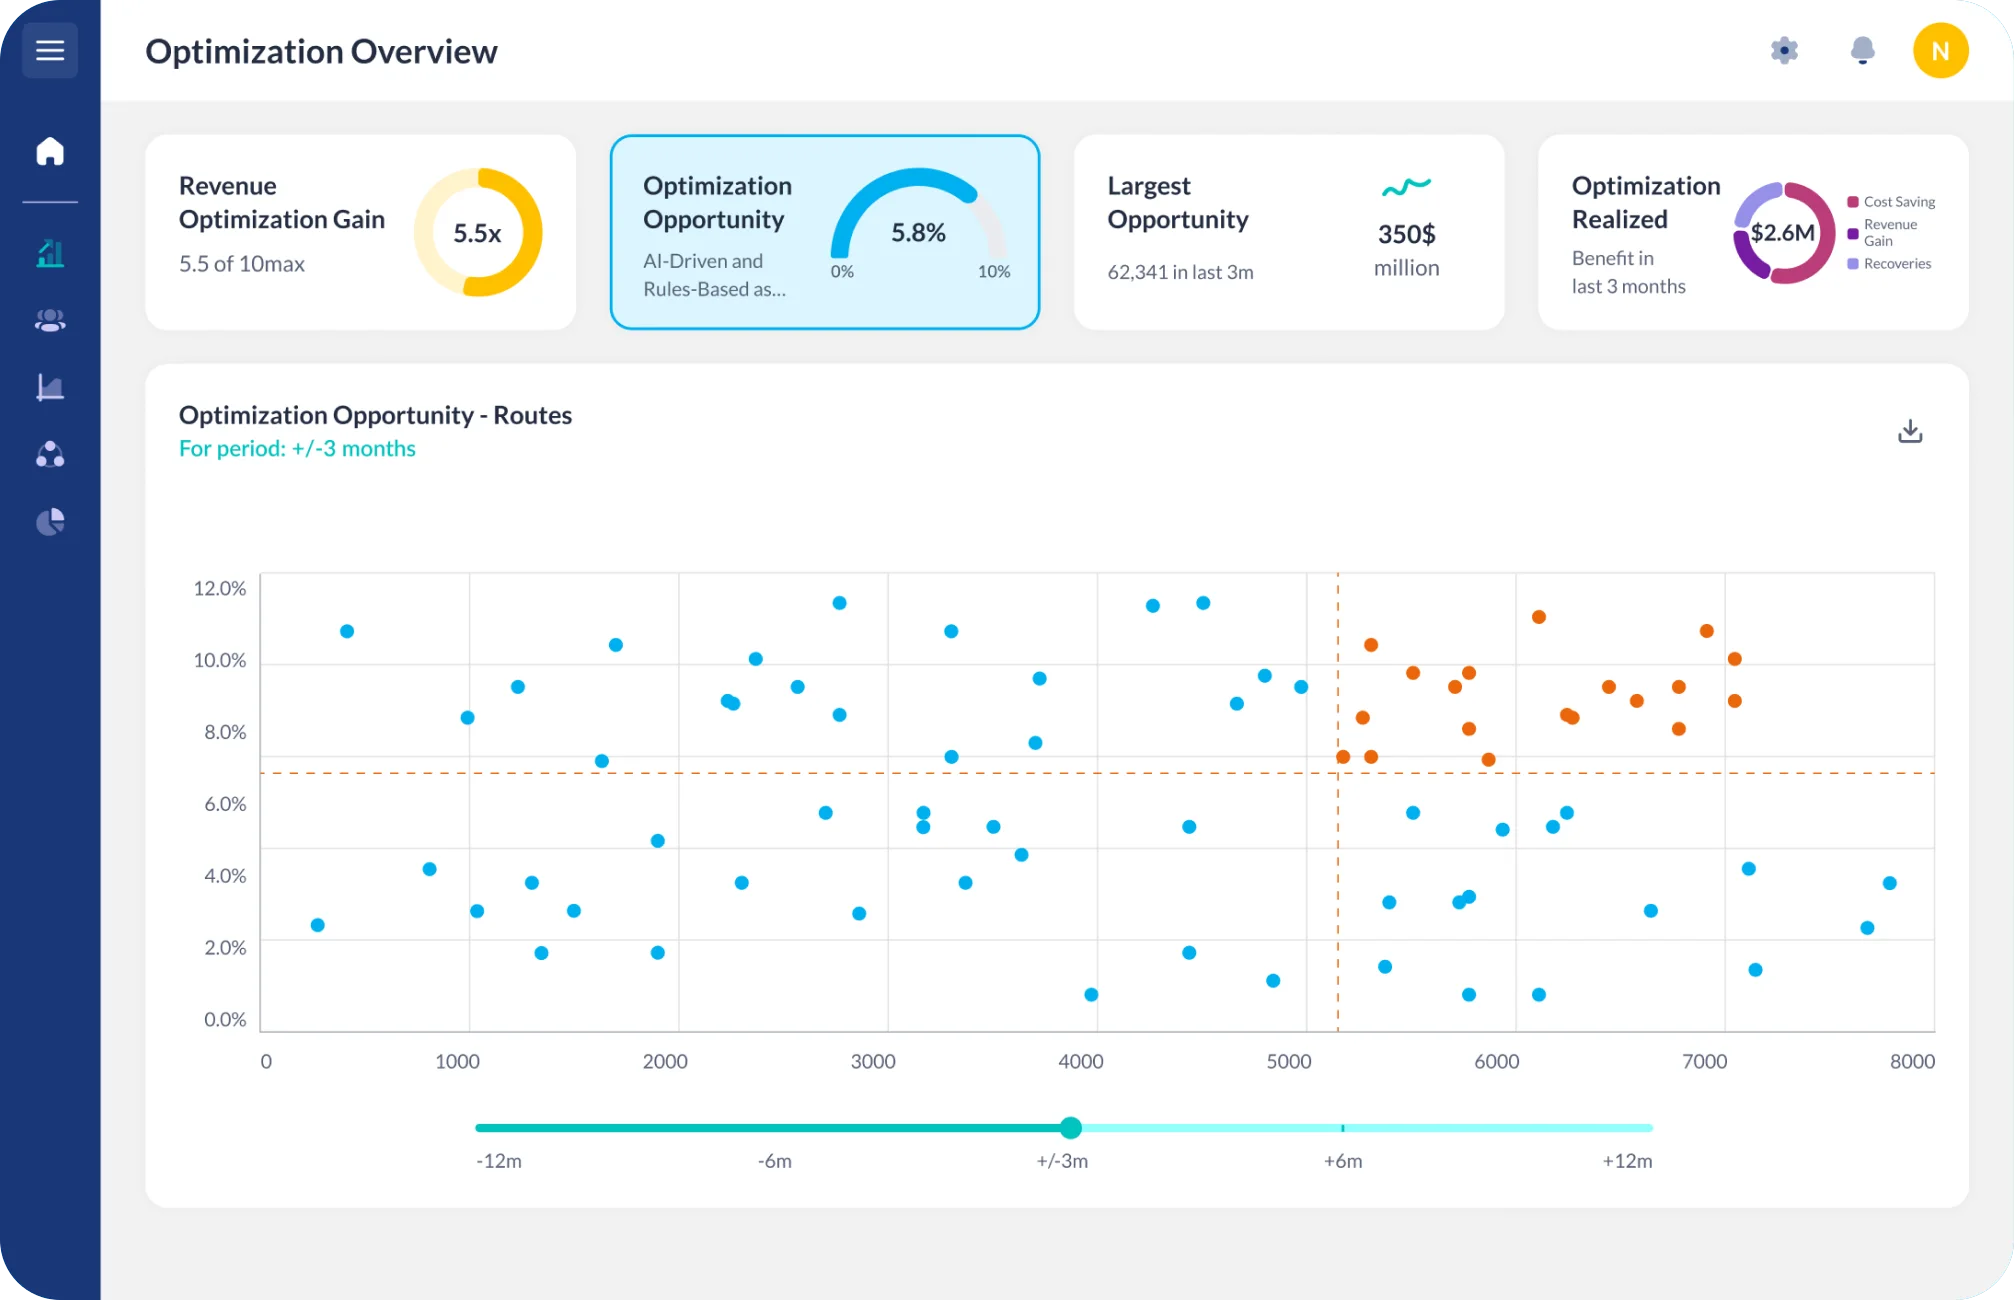
Price every seat for what it's worth, as the market moves.
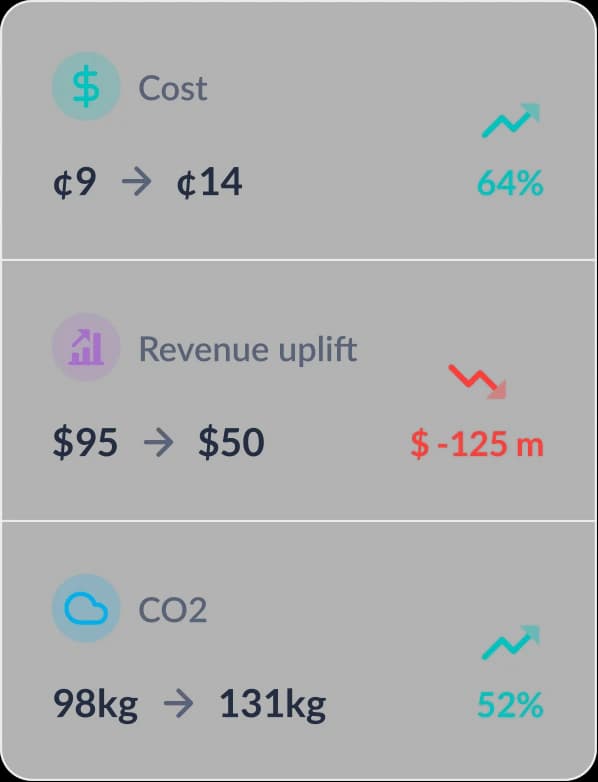
Revenue optimisation uses the platform's data intelligence to guide pricing and revenue decisions as demand and competition shift. Teams act on where the market is going, not where it was in last week's report.
Rule-based and AI-driven workflows sit side by side, so the team automates the repeatable calls and keeps judgement for the ones that matter.
Turning massive airline data into operational intelligence.
See demand before it arrives.
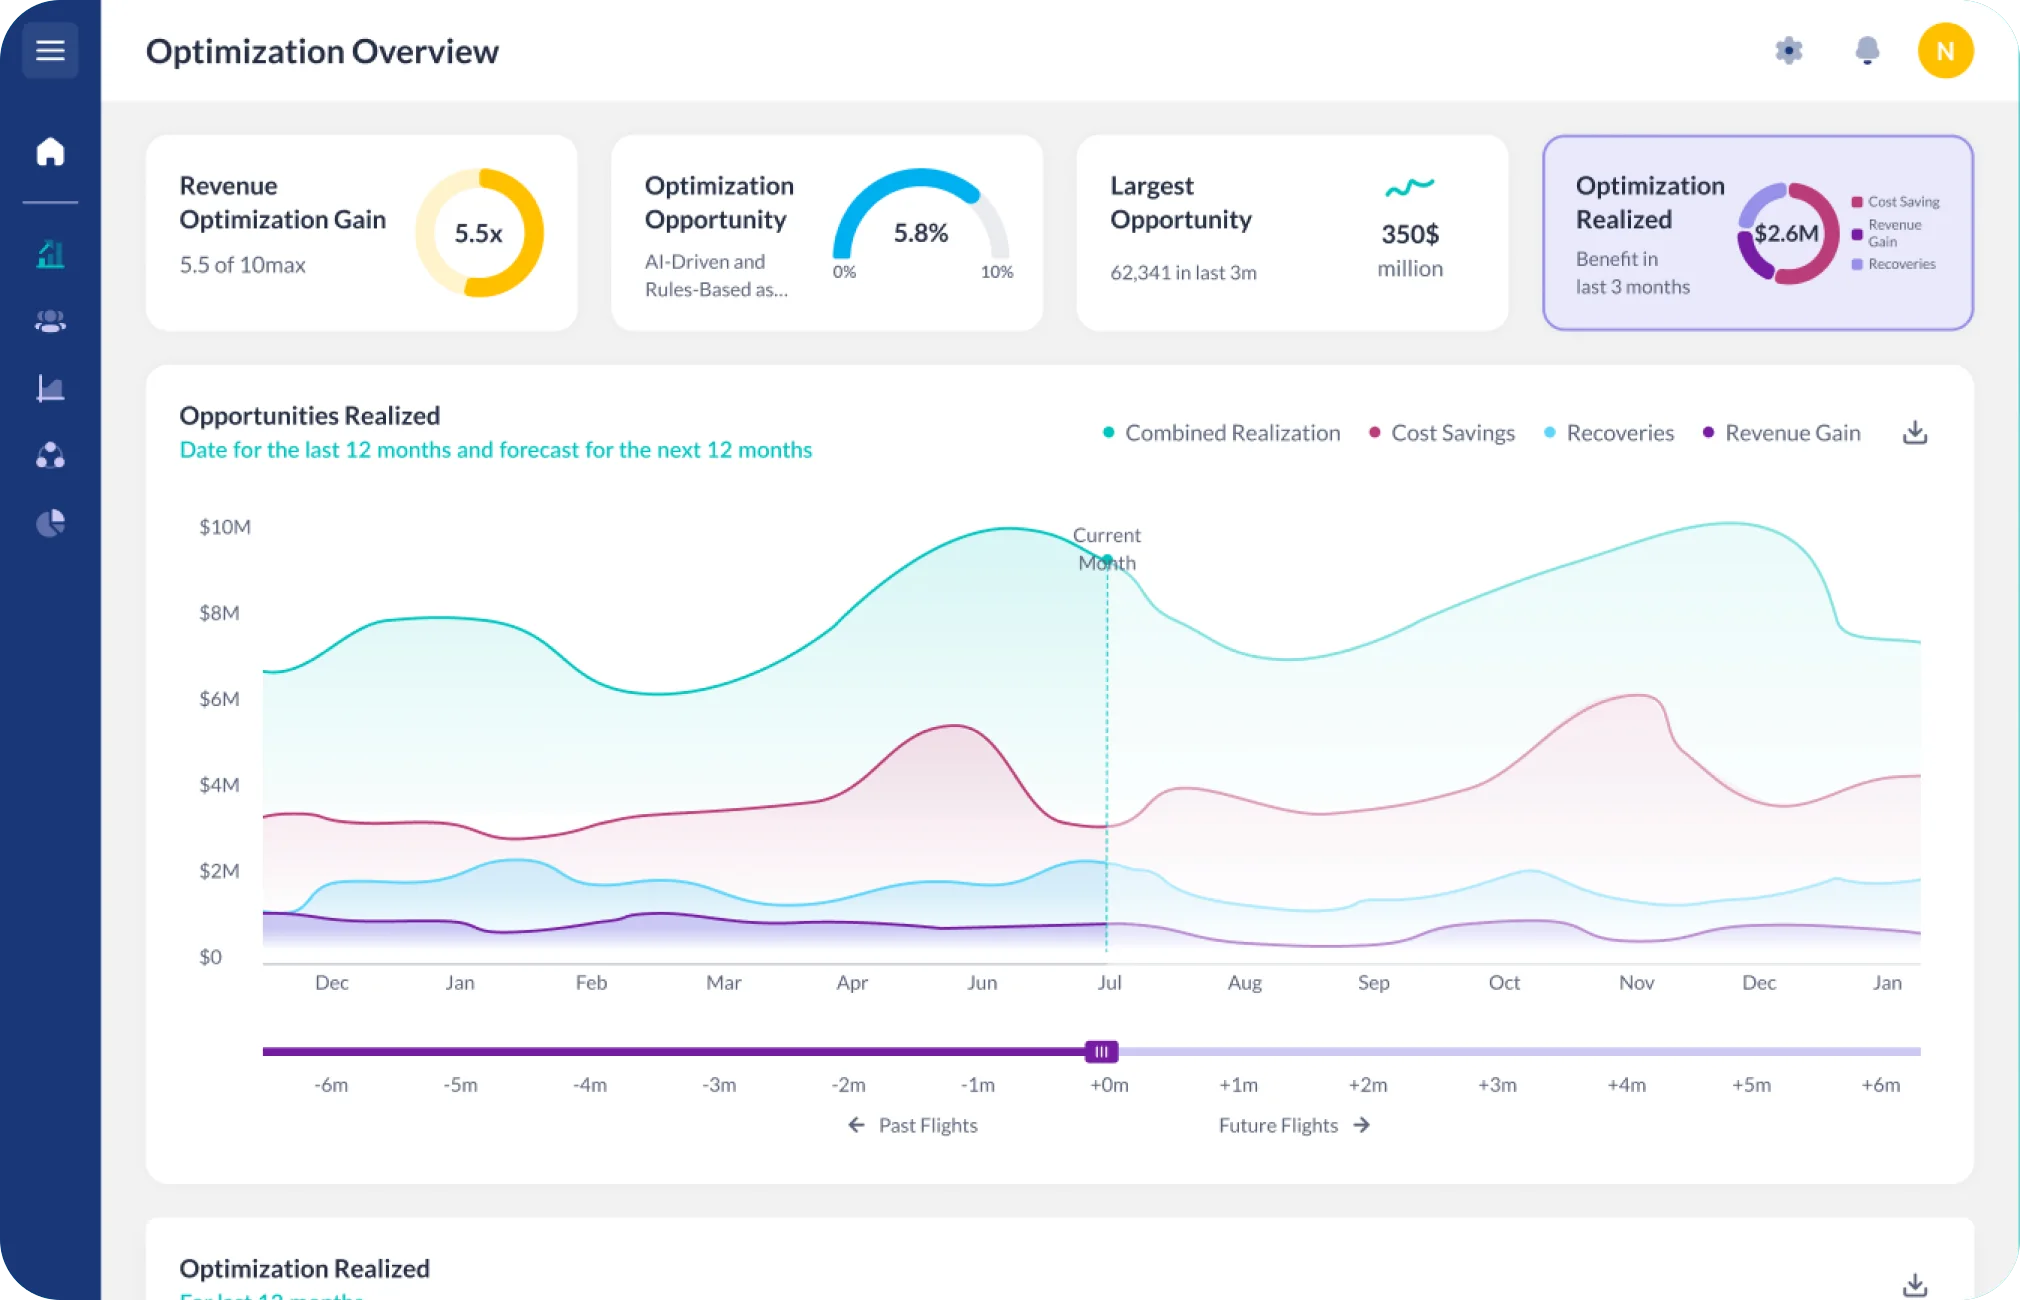
Predictive analytics forecast demand across routes and periods, so commercial teams plan ahead of the curve instead of reacting to it. The forecast is part of the same system as the decisions it informs, not a separate spreadsheet.
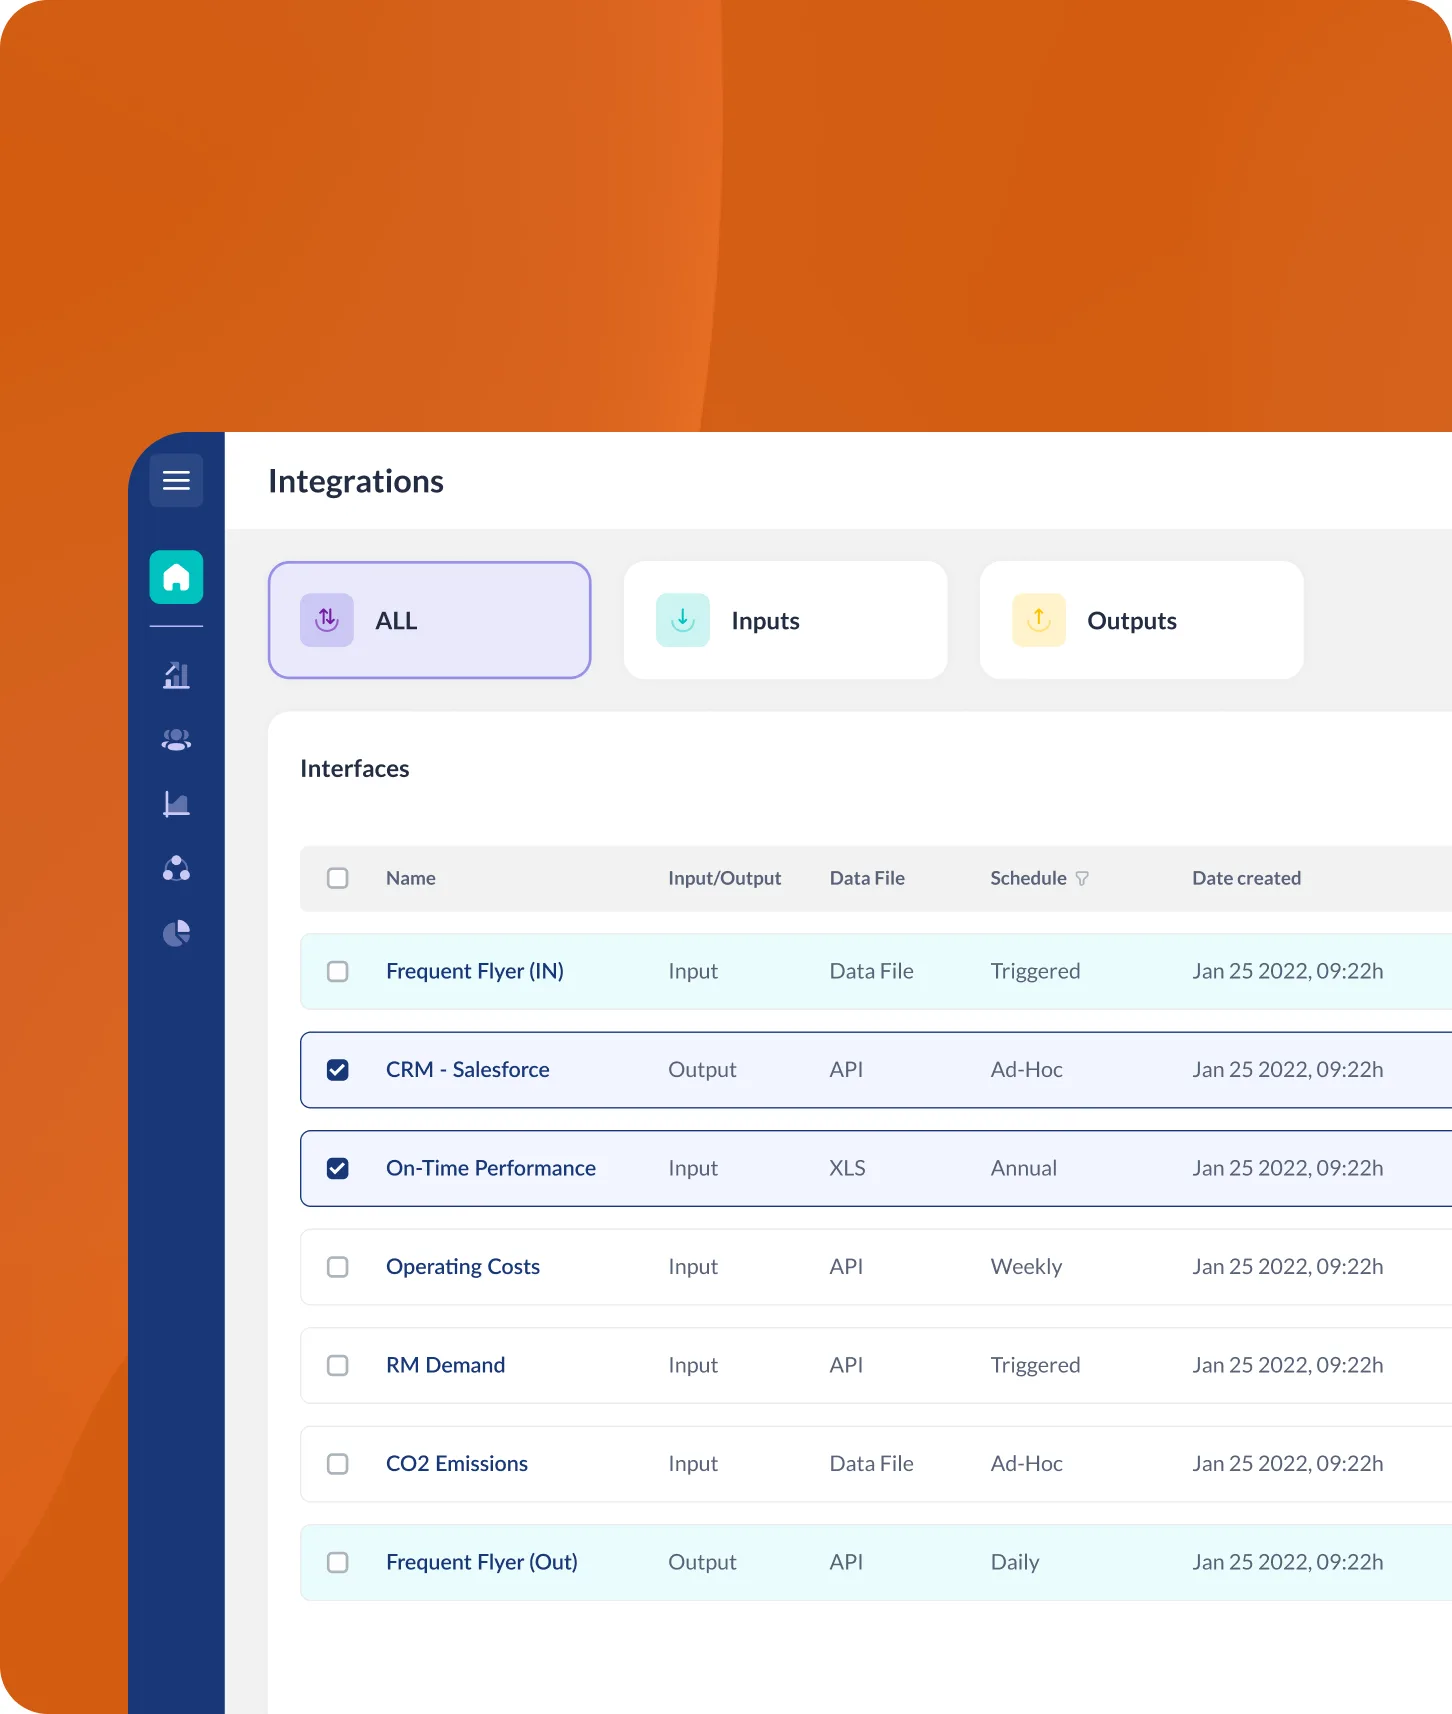
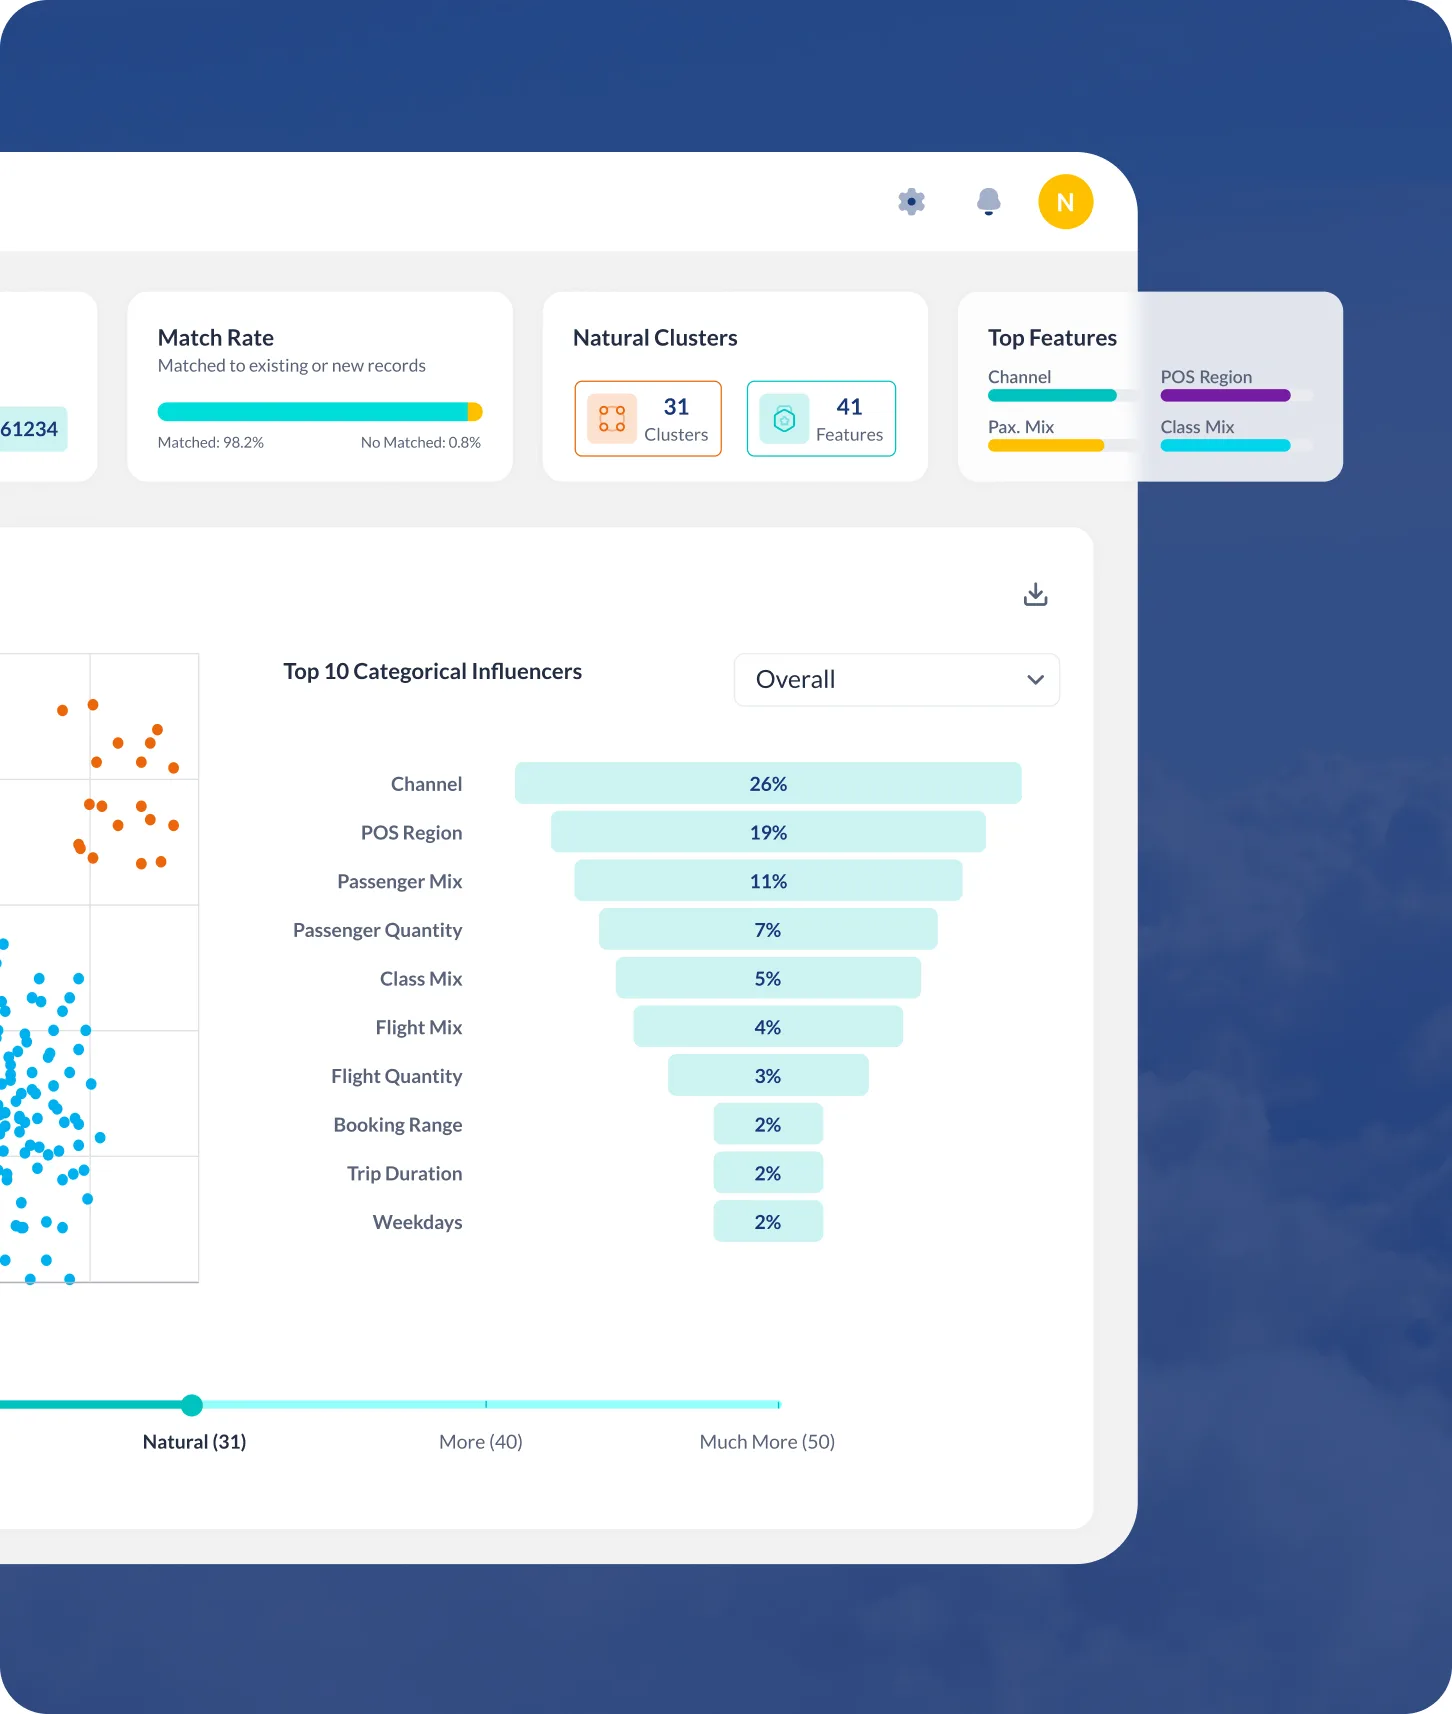
The customer behind every booking, in view.
Customer insights consolidate behaviour and operational data into a picture a commercial team can act on: who is flying, how they buy and where the opportunity sits.
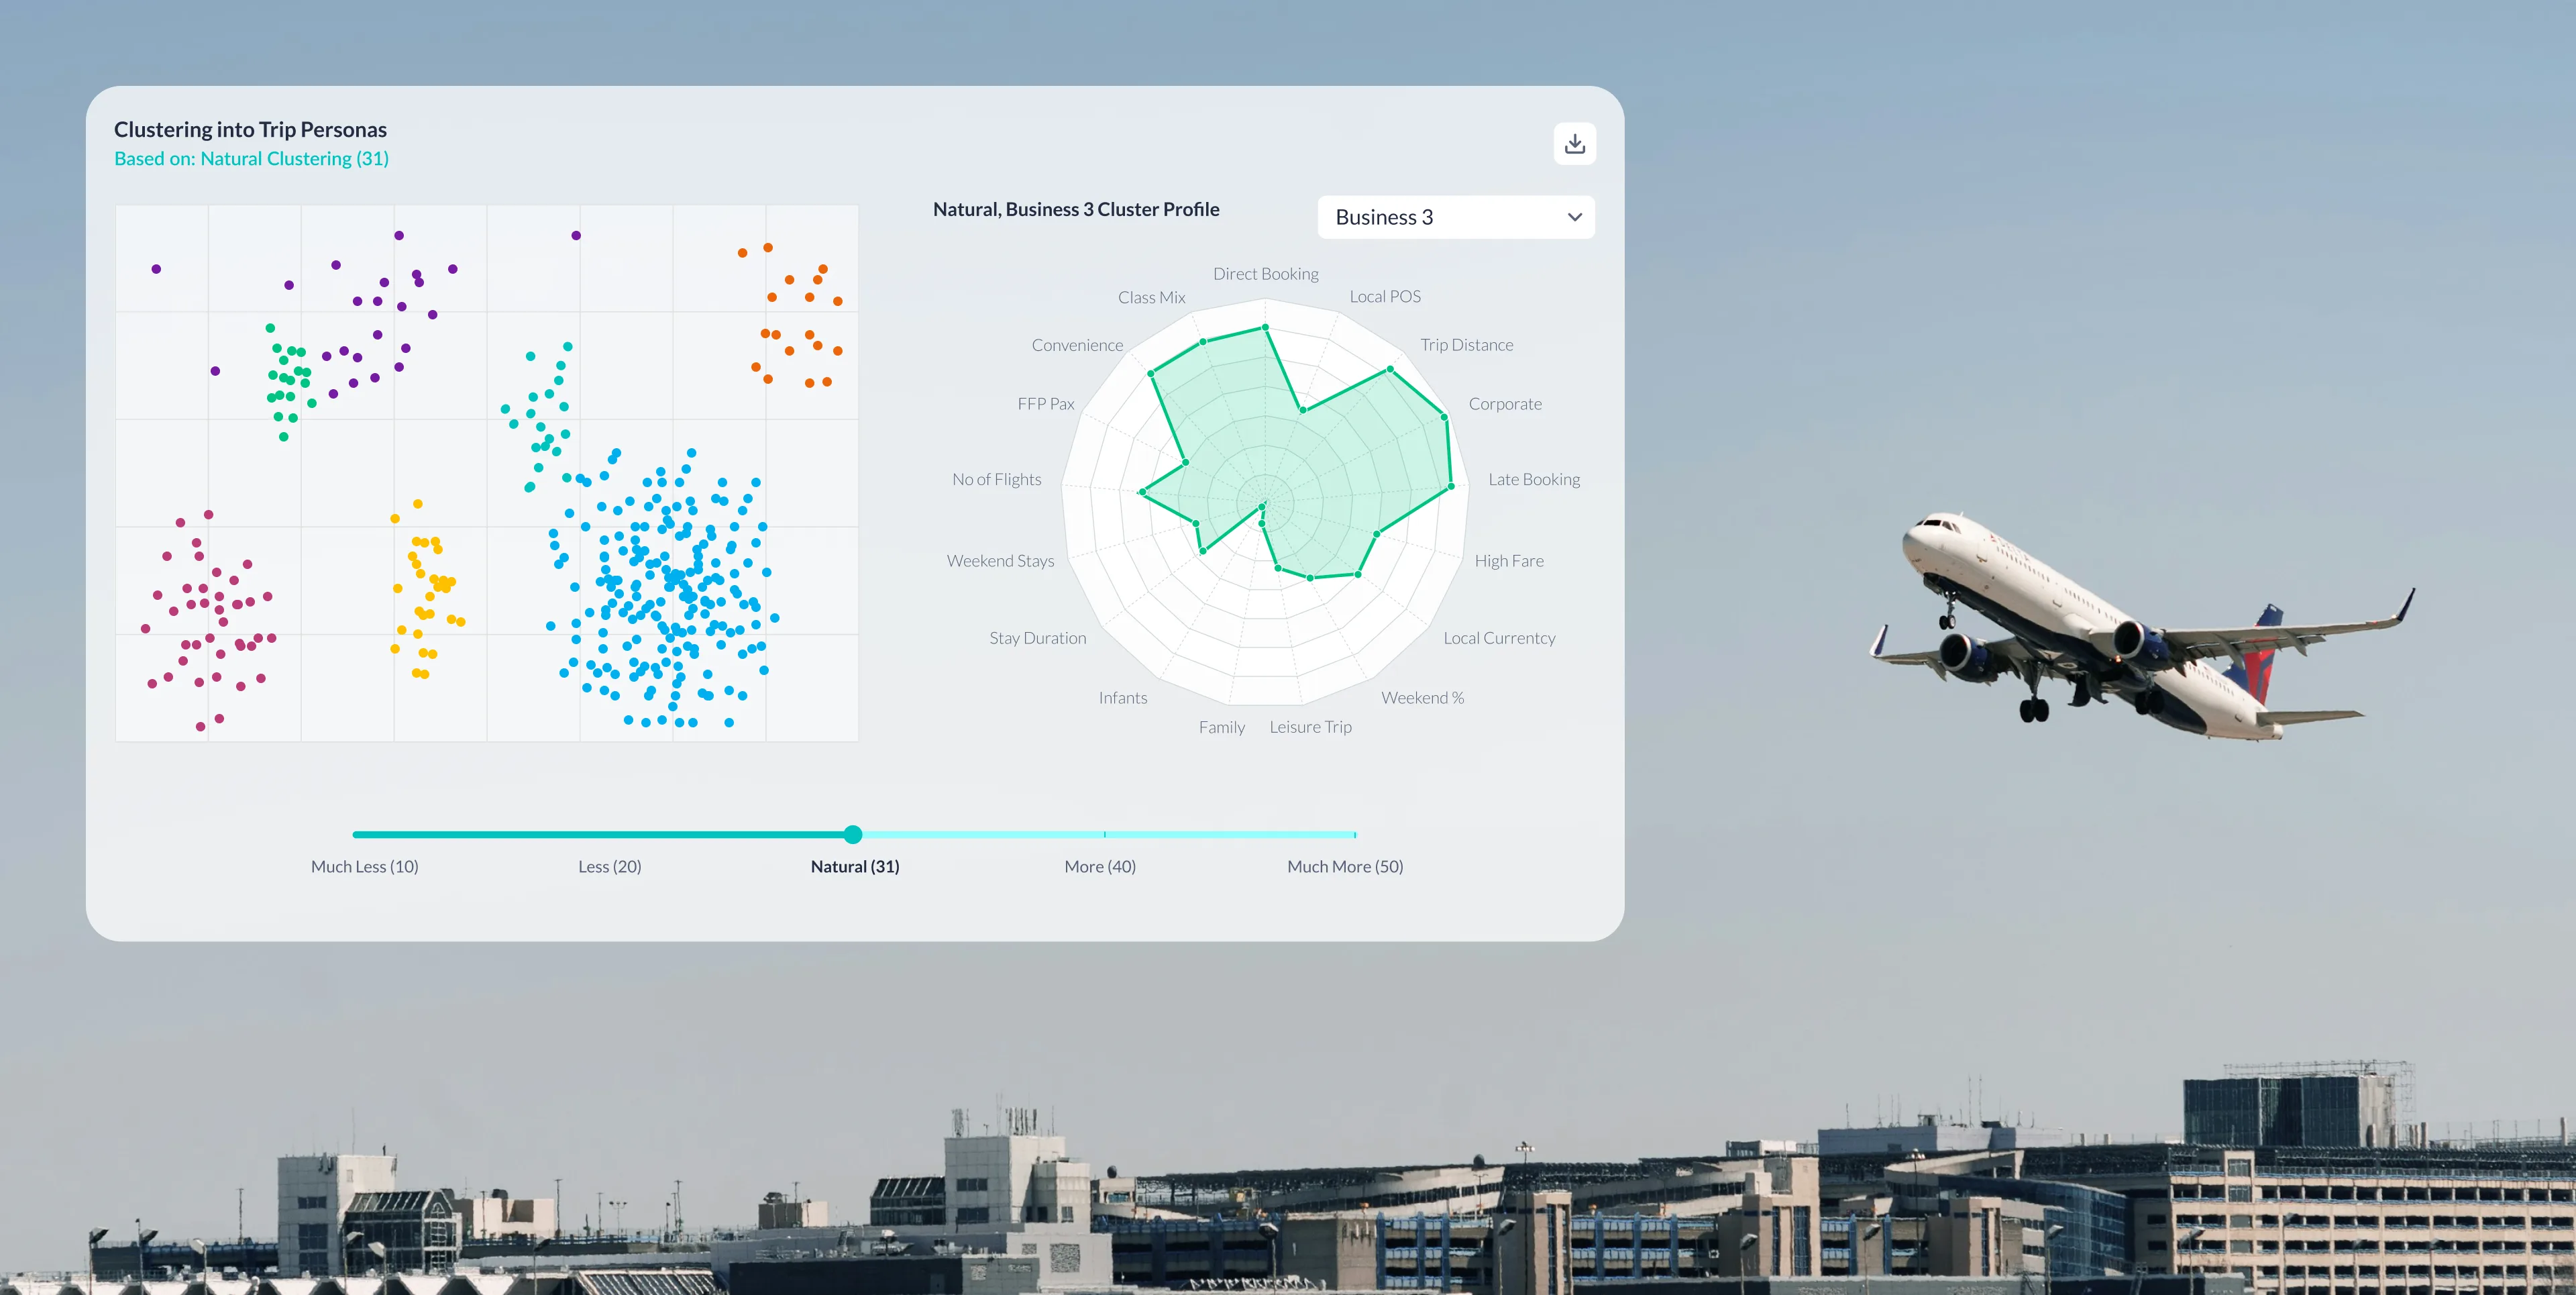
Complex data on screens built to be read.
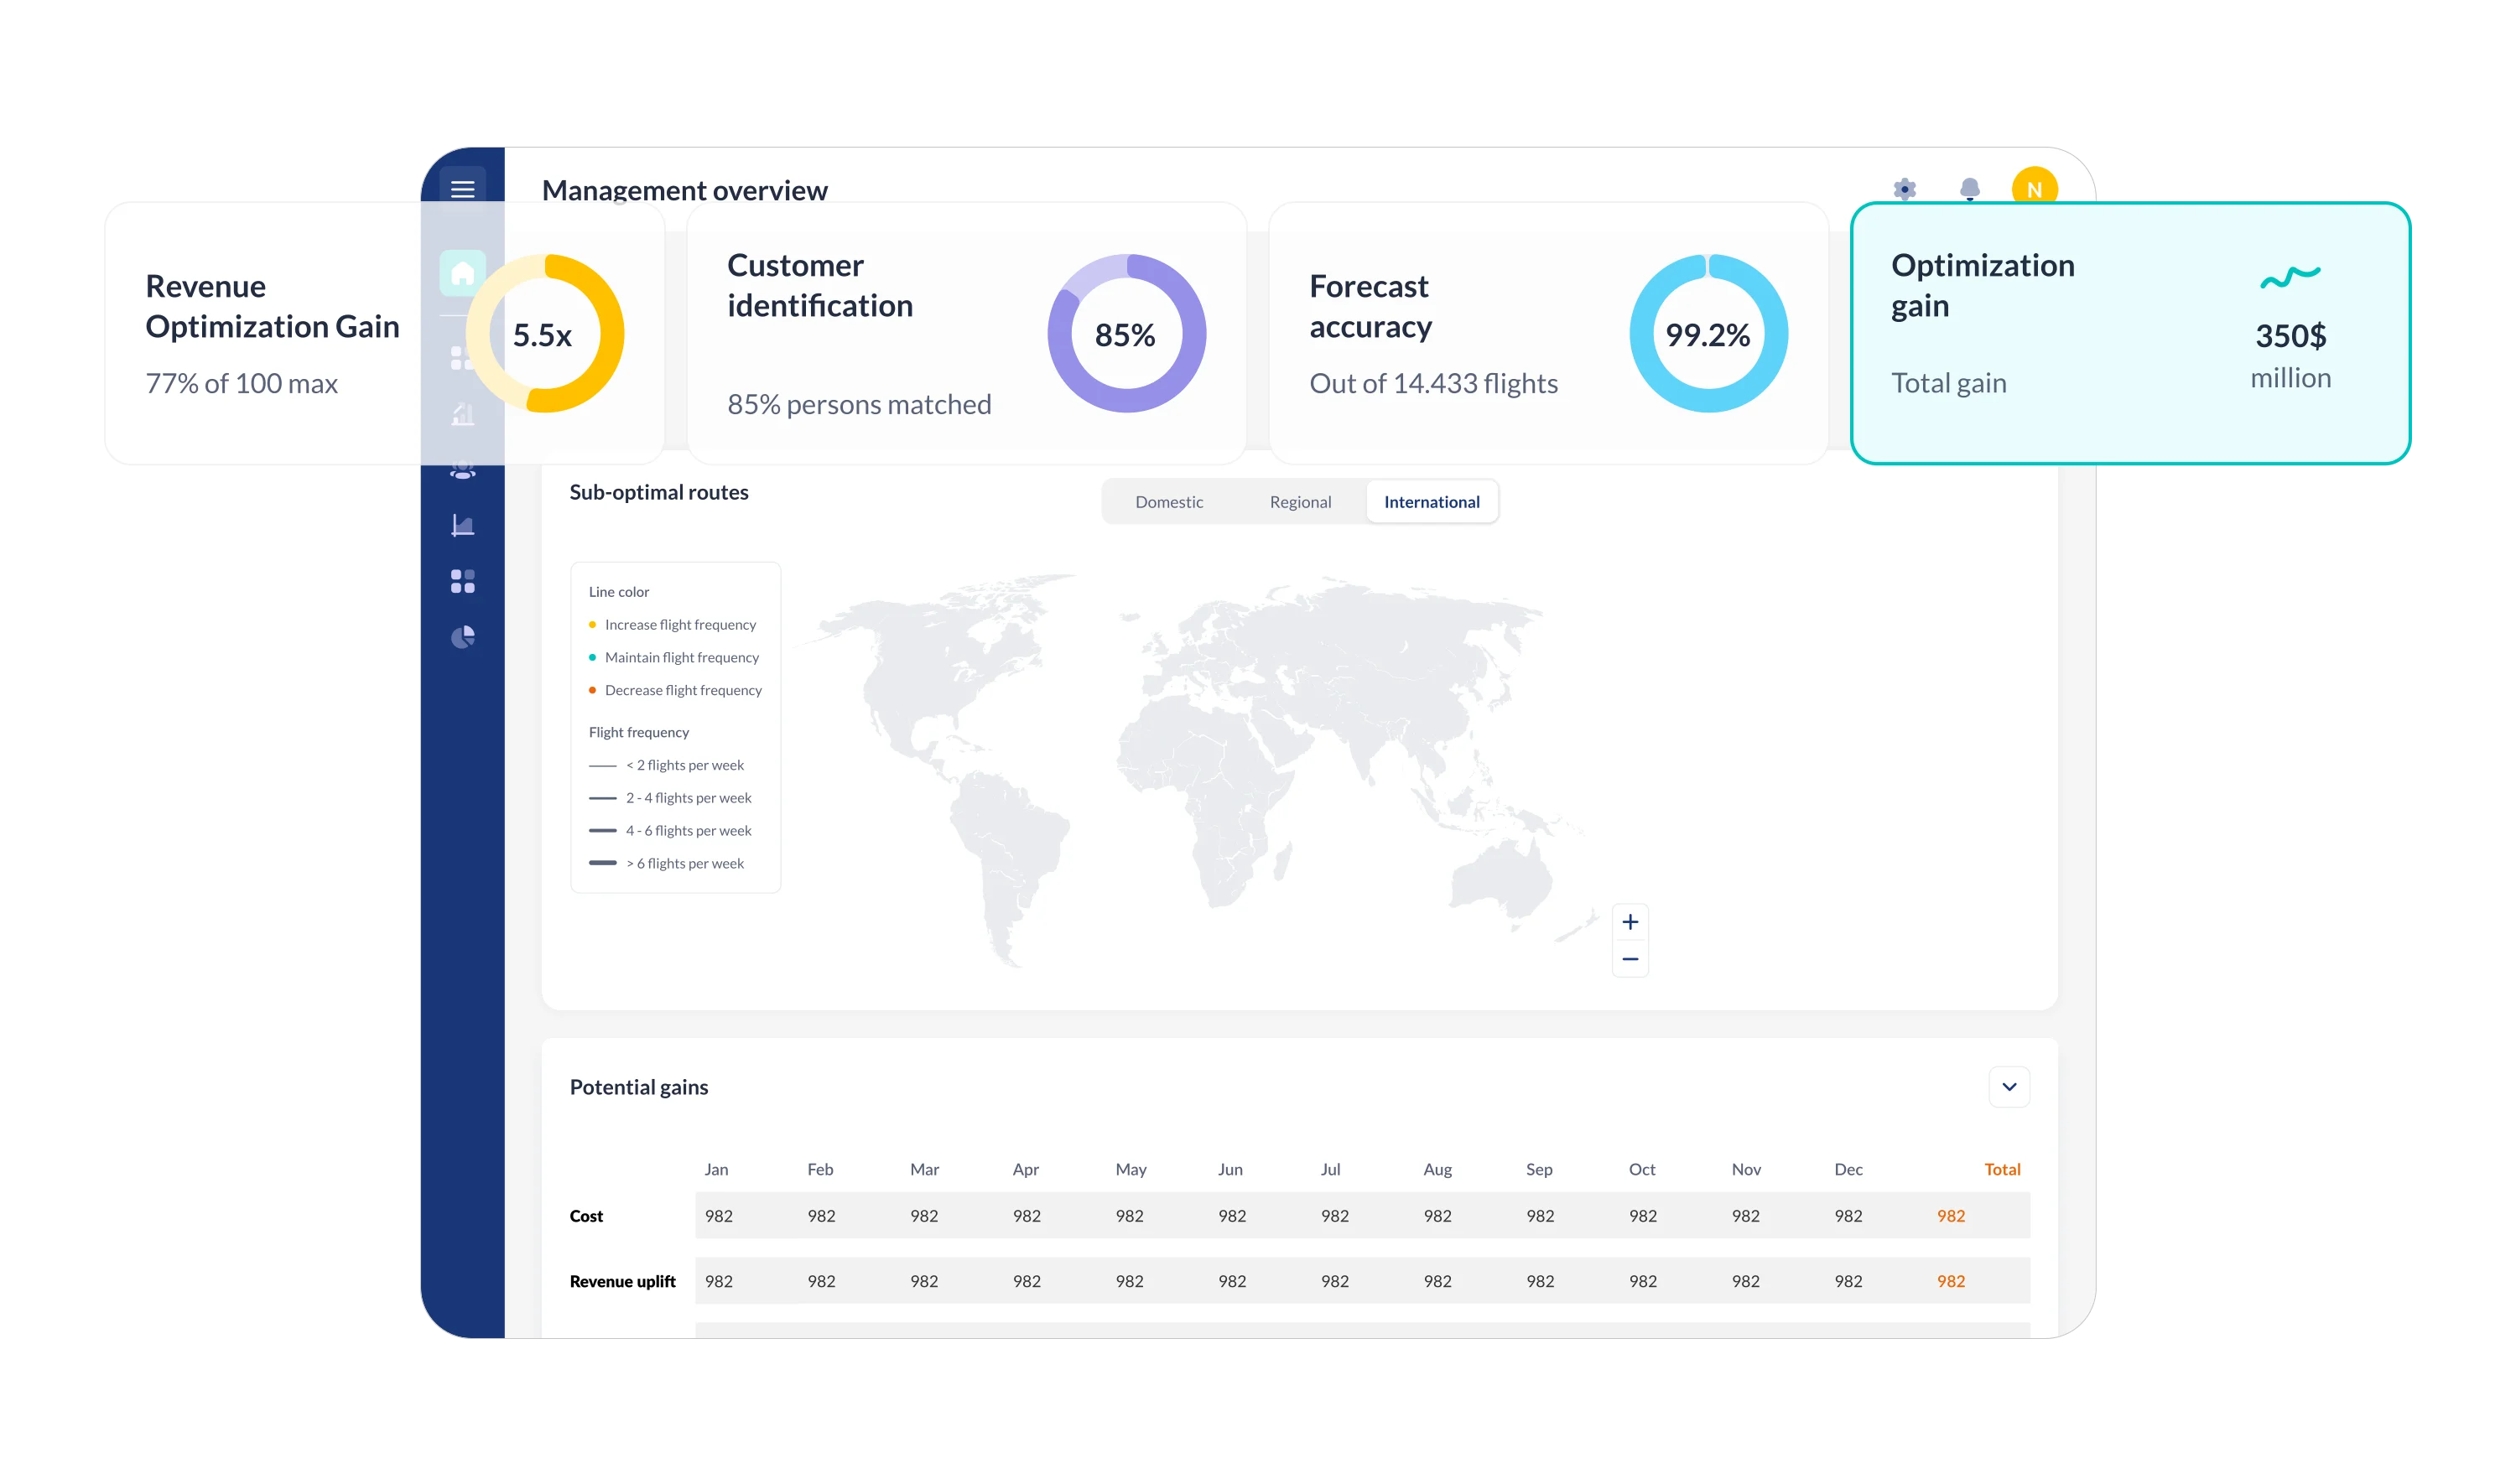
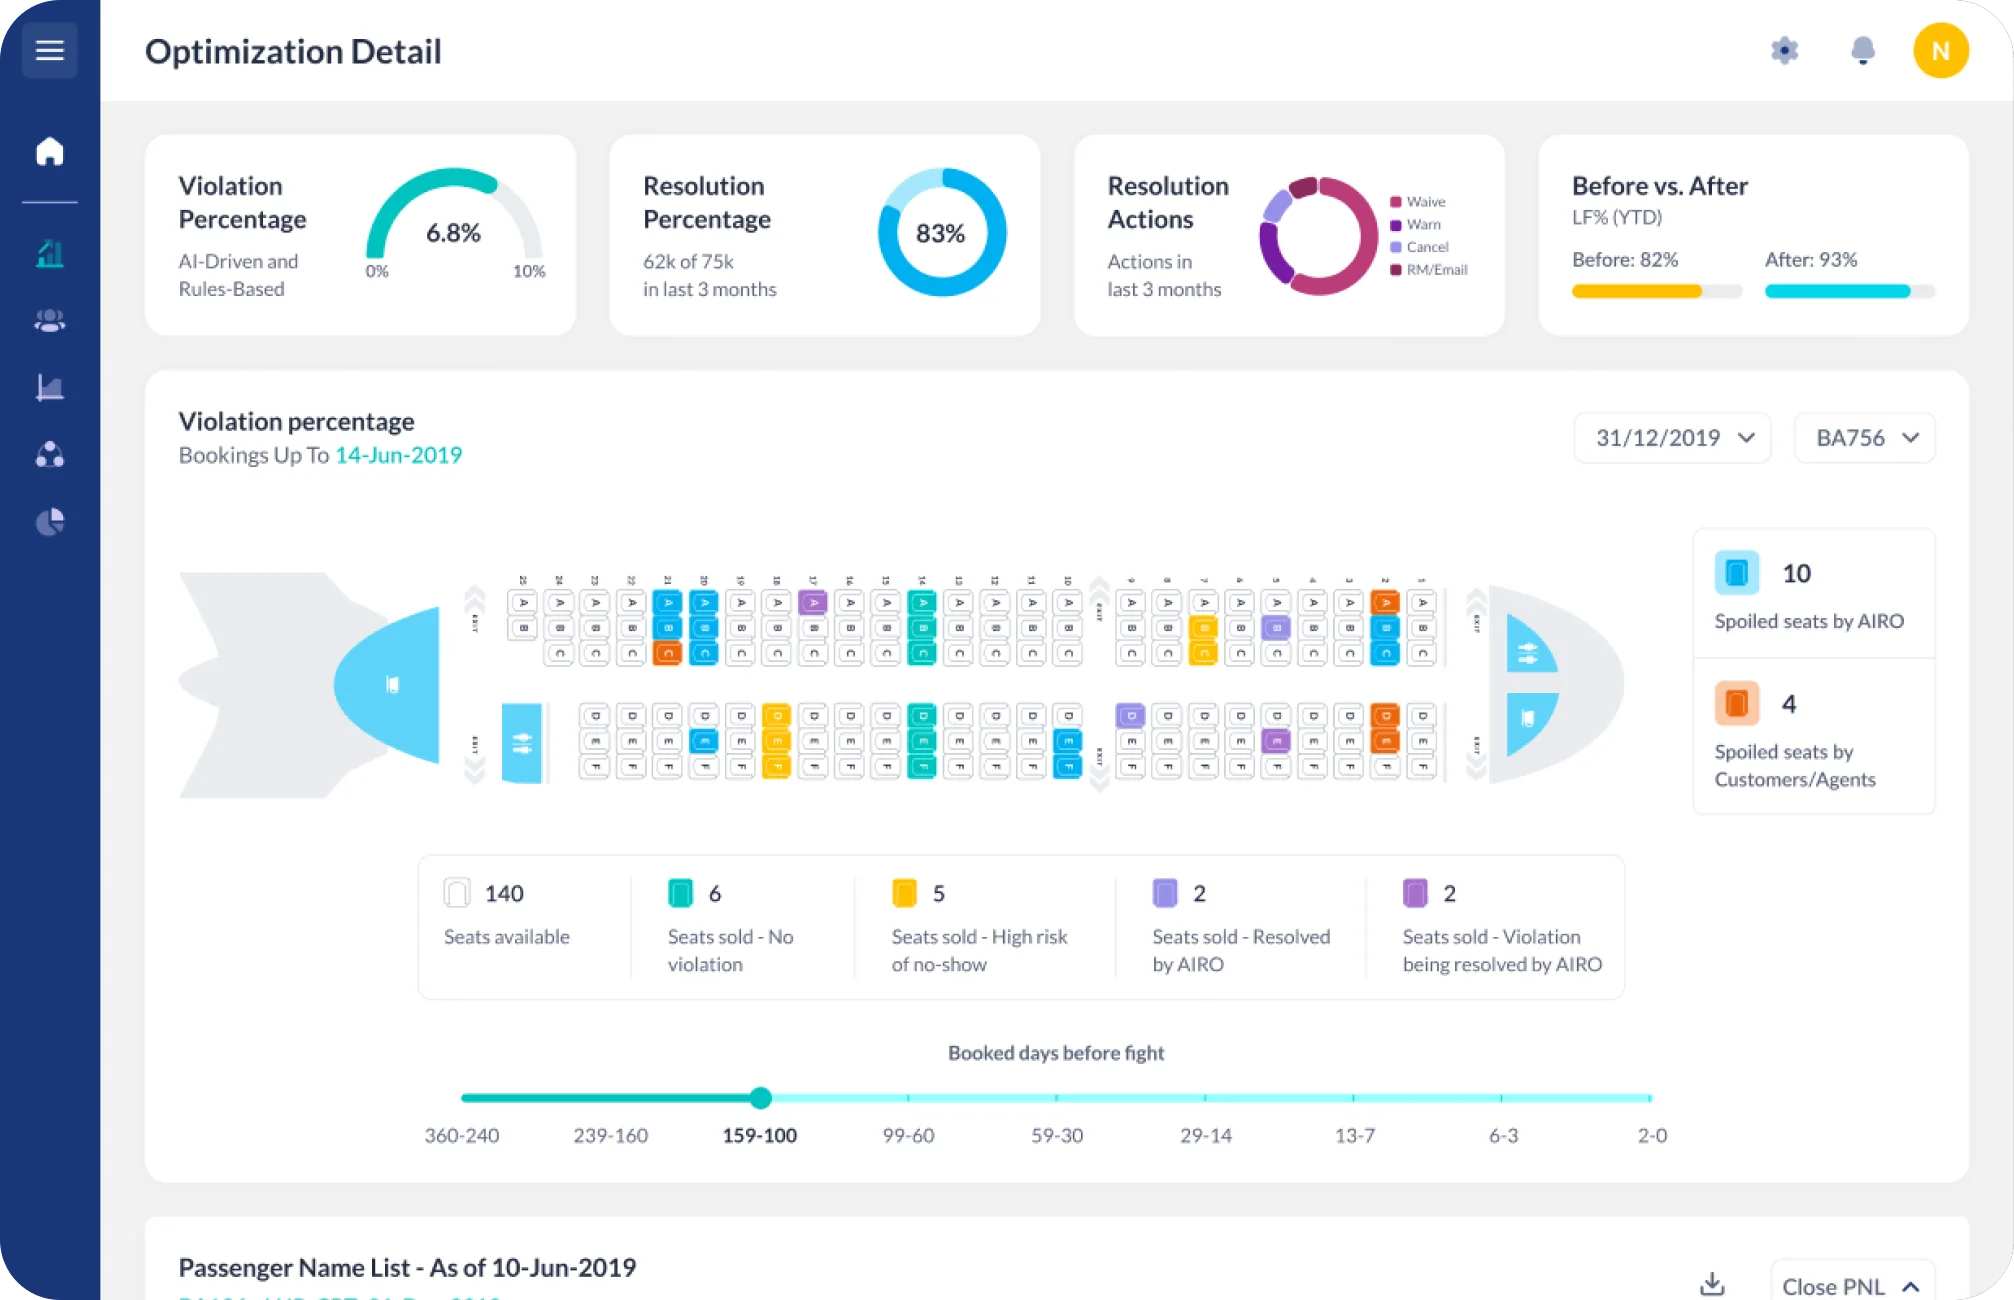
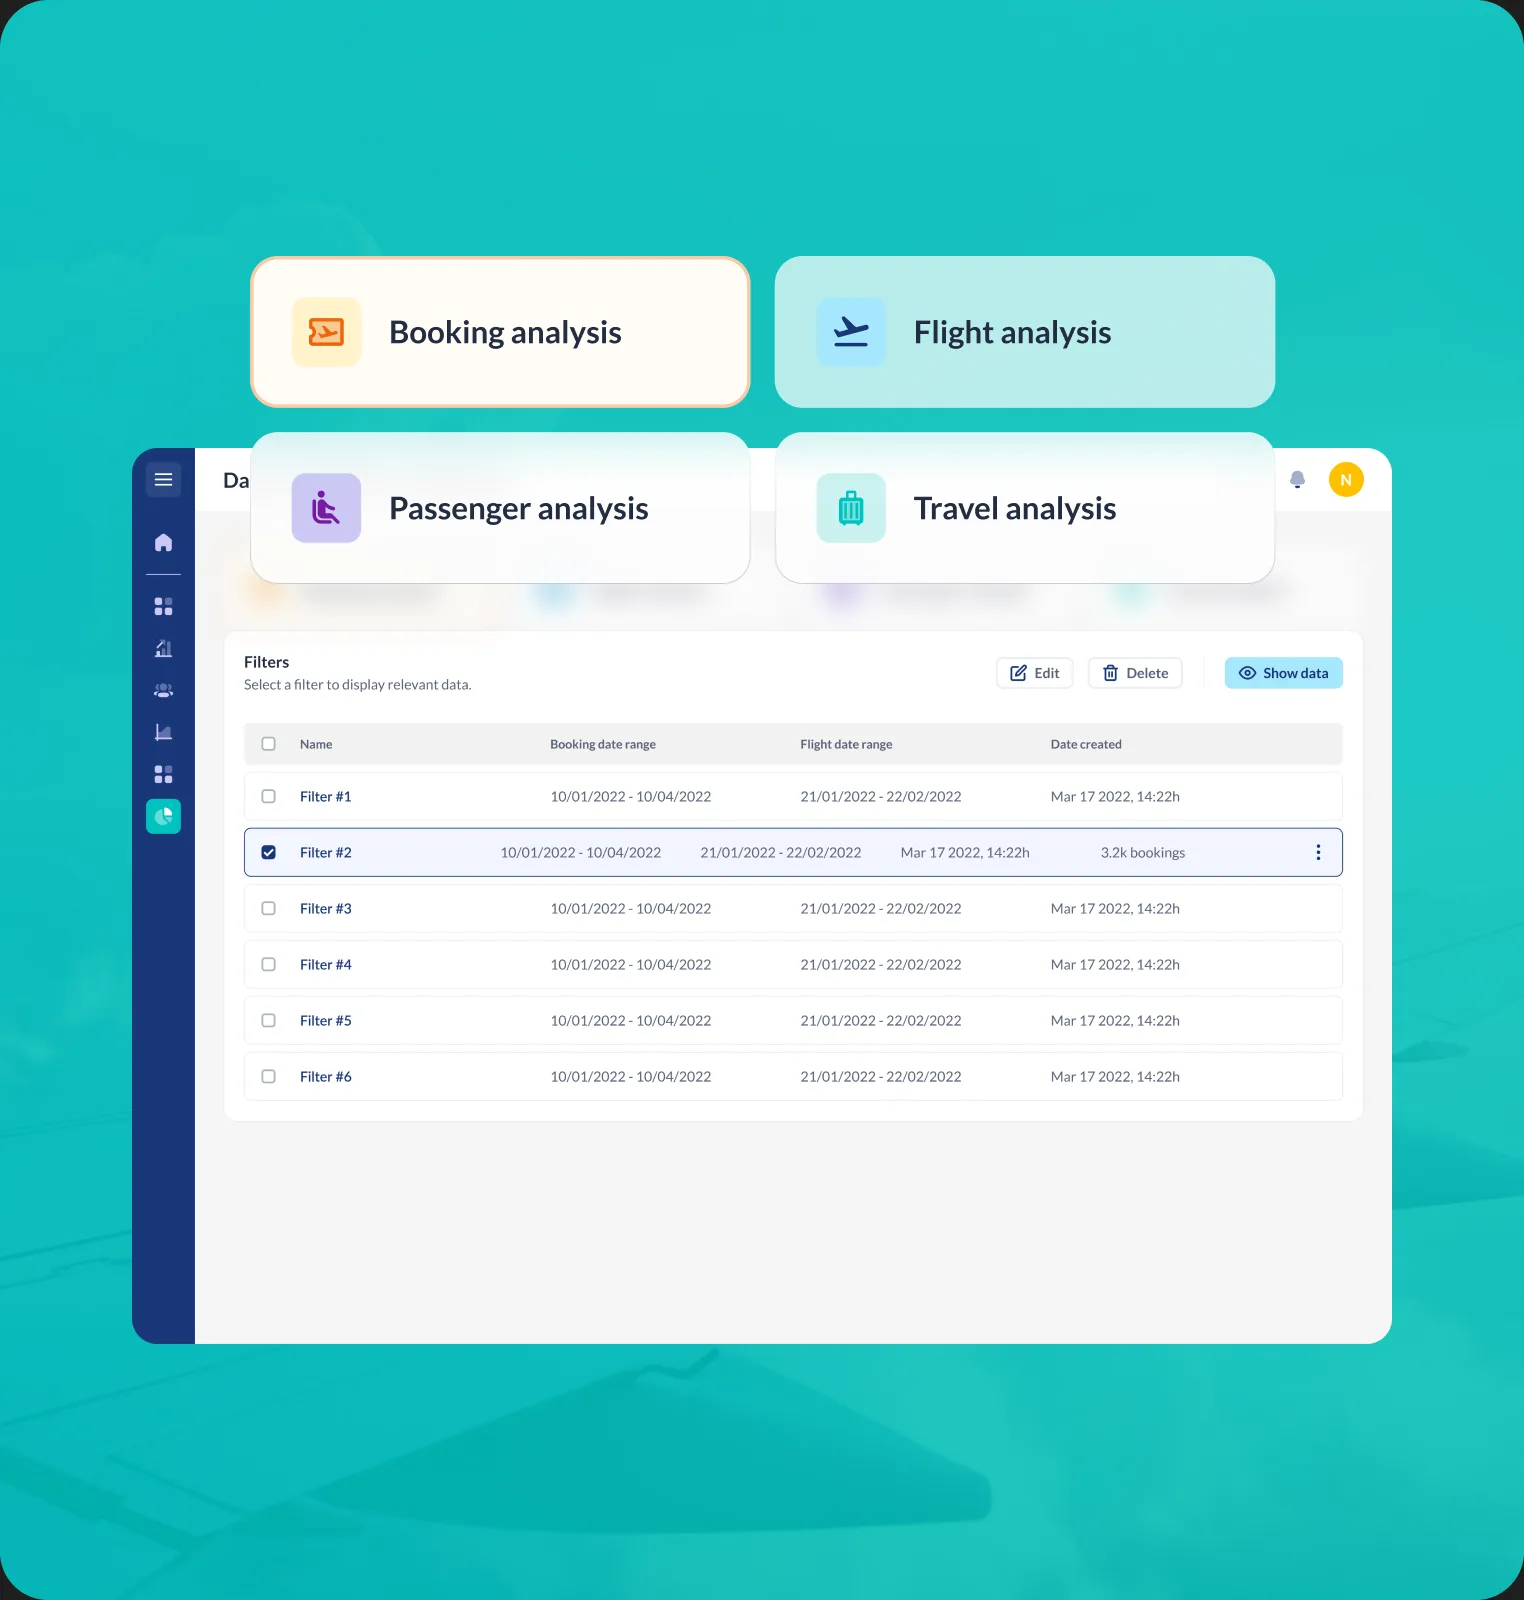
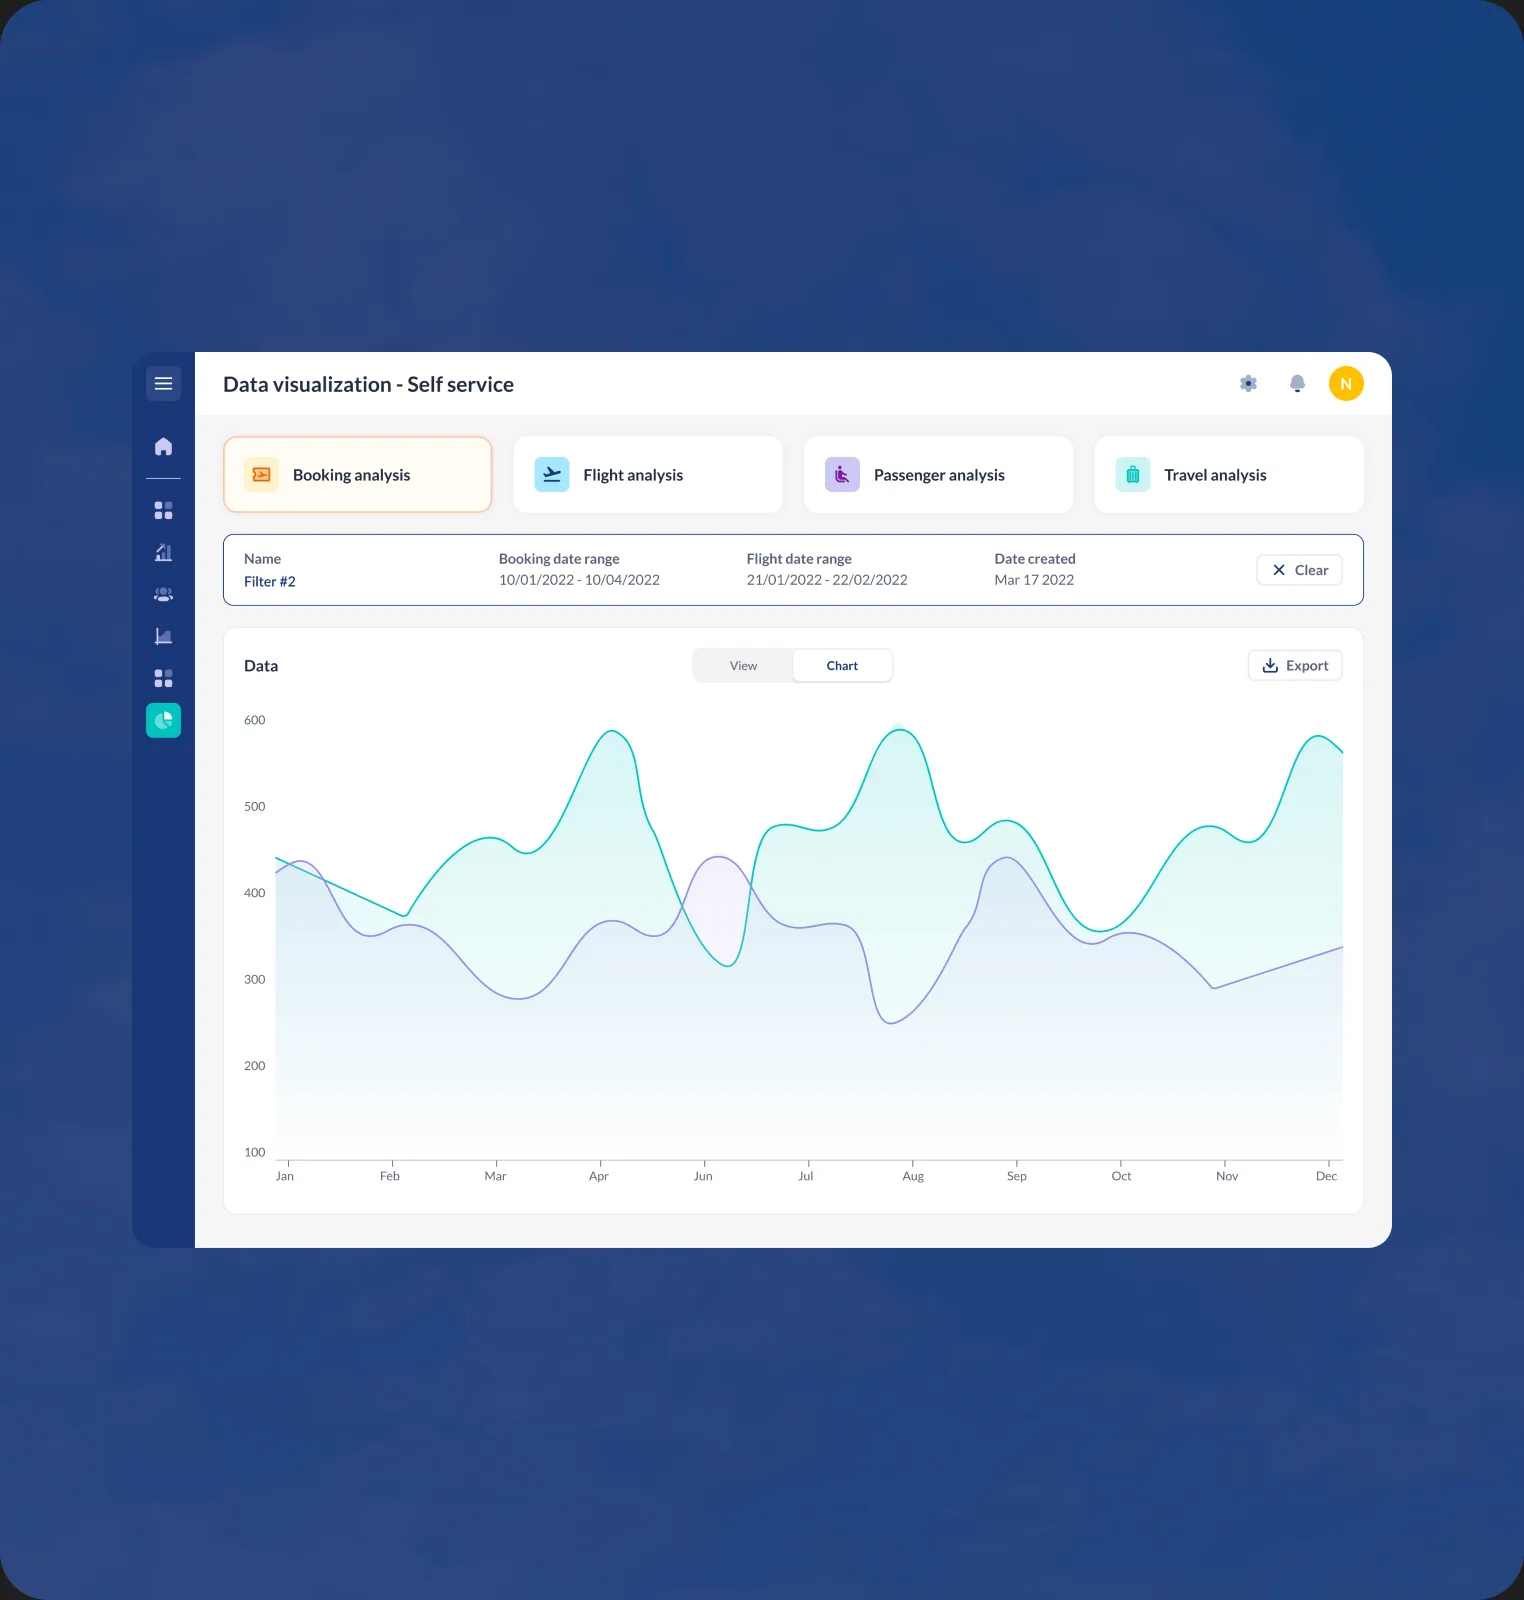
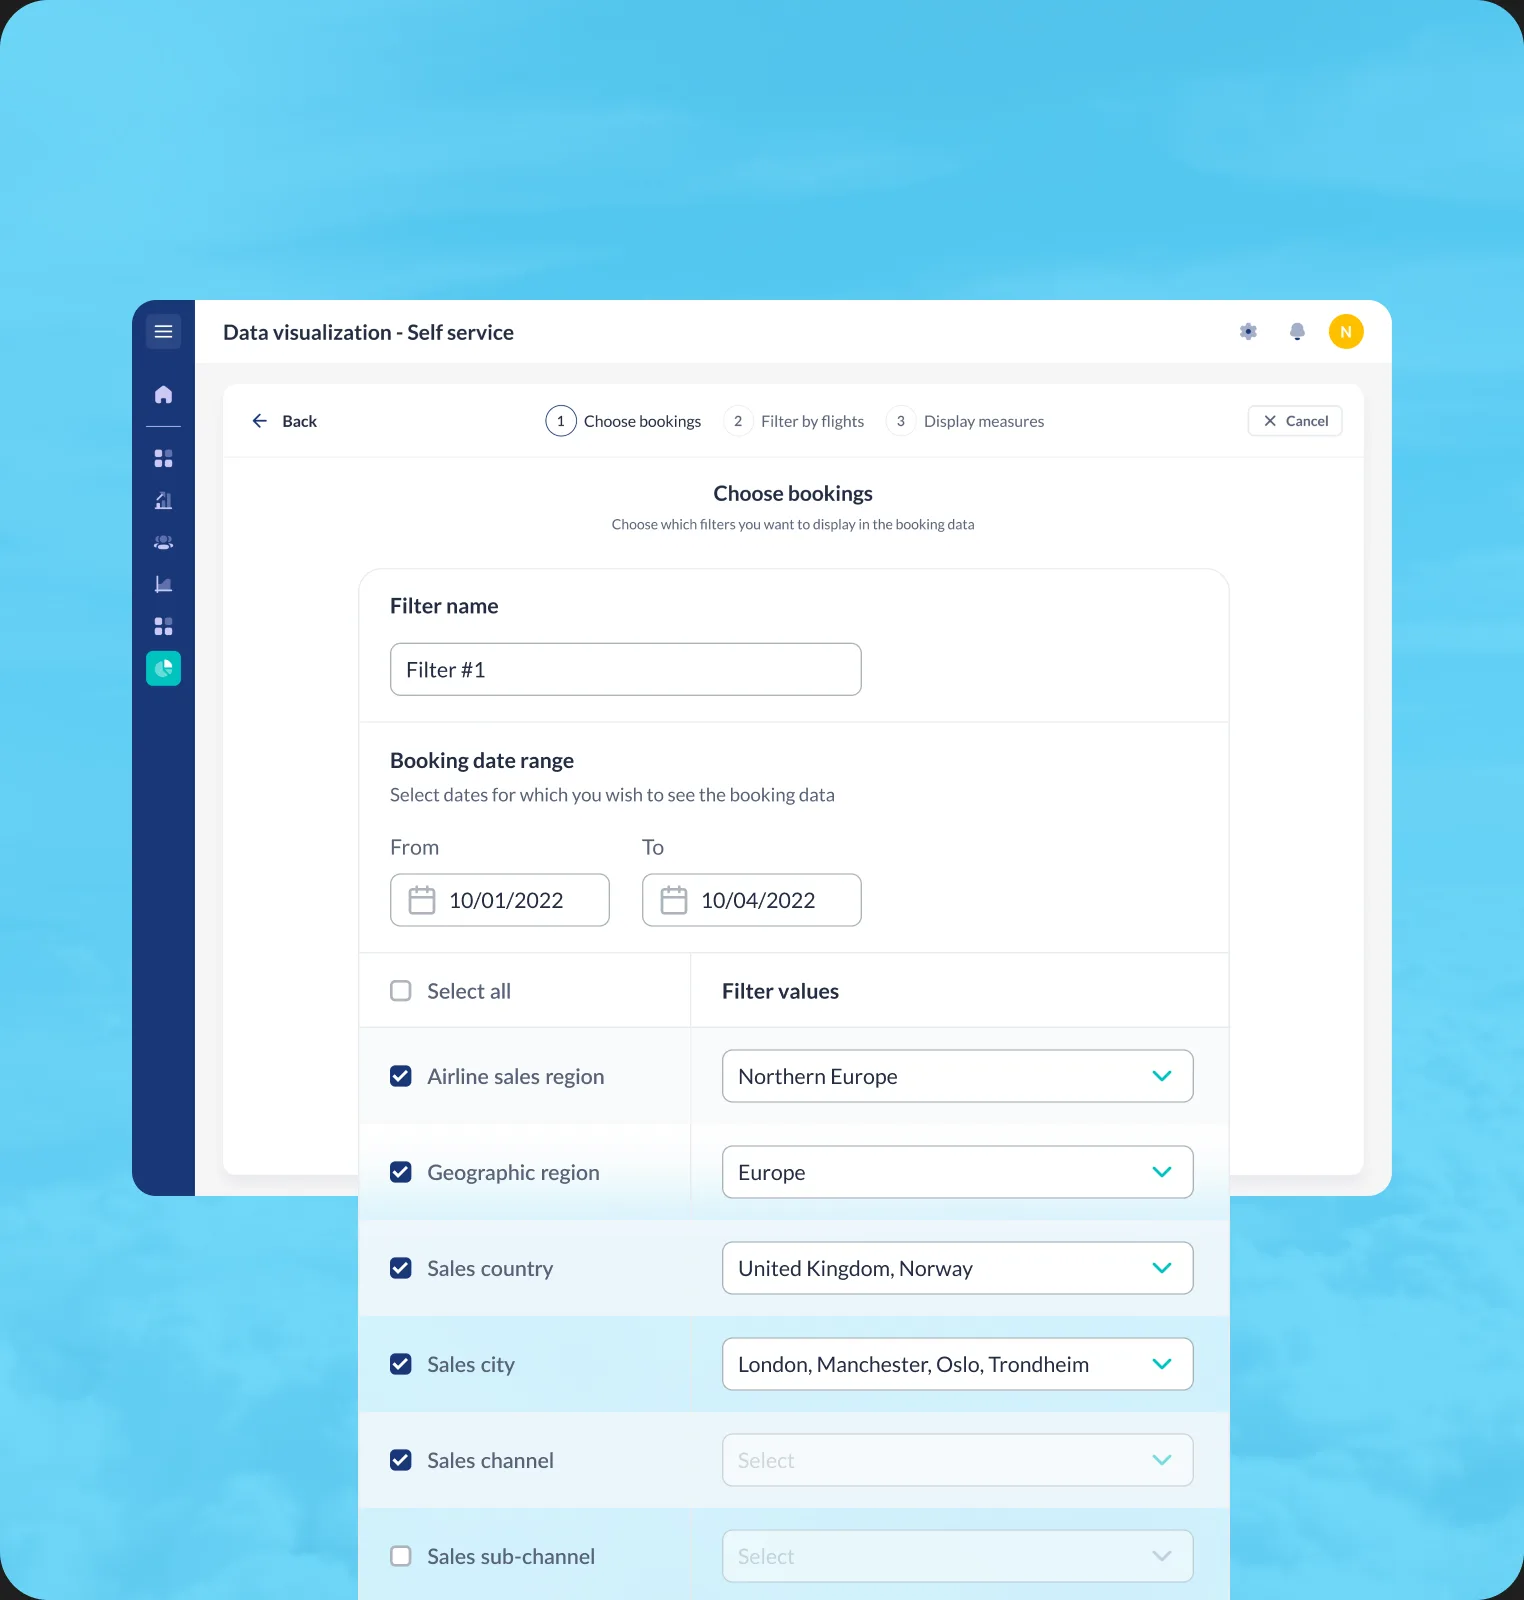
This is where the platform earns its trust. The visualisation layer presents revenue, demand, network and customer data through purpose-designed charts and dashboards, so a commercial team sees the whole operation clearly and drills into any part of it. Saved filters slice booking, flight and passenger data down to the exact question being asked, so one dashboard answers a dozen of them.

Every commercial lever an airline pulls is part of this product.
Whether you're validating an AI product, designing for dense enterprise data or building the system underneath it, we'll help you choose the smallest sensible starting point and a delivery model that fits your team.
Our playbook for integrating AI into product design and development workflows.
Download the playbook